Citizen science and roadkills: trends along project lifespan
and comparison of tropical and temperate projects
Julián Monge-Nájera & Carolina Seas
Laboratorio de Ecología Urbana, Vicerrectoría de Investigación, UNED, 2050 San José, Costa Rica; julianmonge@gmail.com, cseas@uned.ac.cr
Received 14-XX-2017 • Corrected 30-XX-2017 • Accepted 12-XX-2017
ABSTRACT: The collection of scientific data by people without a science degree is at least as old as Antonie van Leeuwenhoek, but thanks to smartphones it now involves large numbers of volunteers, leading to studies about who the so called “citizen scientists” are, how they behave, and how to improve their work. There are, however, no worldwide studies about citizen science projects reporting fauna killed in road collisions. Here we analyze data from the 31 projects available in September 2017 in iNaturalist.org, the largest website for this subject. The USA and Europe have the most projects, but after correcting for population size, countries like Costa Rica and Canada are outstanding, possibly thanks to widespread Internet access and high educational levels. Projects had a mean of 431 observations, 48 species, of 32 volunteers who, on average, posted 19 observations each. Most volunteers contributed few records and were active only briefly. The roadkill data shows that, in the tropics, seasonal mortality trends match the movement of animals in search of water for drinking and for reproduction, while in temperate sites project differences depended mostly on which particular species is studied. We recommend future consideration of how the behavior of volunteers and projects changes along time, a subject that has seldom been considered in previous studies.
Key words: road mortality; road ecology; community; volunteers; online database.
Citizen science, defined as scientific work done by people without a scientific degree, is as old as modern science itself. Perhaps the most famous case was chamberlain Antonie van Leeuwenhoek, who made detailed microscopic observations for the Royal Society from 1673 to 1723 (Gest, 2004). More recently, some citizen science projects have been active for over half a century (Gommerman & Monroe, 2012; McKinley et al., 2017).
Citizen science projects are considered useful when large scale data are needed, and in the case of biology, common applications include phenology, climate change, pollution, species distribution, population fluctuations and ecosystem productivity (Dickinson et al., 2012; Chandler et al., 2017).
In an epoch full of challenges that range from rapid climate change to reduced political support for science (Fleur, 2017), citizen science is a means of obtaining reliable large data sets at very low costs, particularly because “citizen scientists” normally work for free and use cheap technology like smartphones (Chandler et al., 2017). However, despite laudatory opinions matching citizen observers with professional scientists (e.g. McKinley et al., 2017), citizen science data can be insufficient, biased or plainly wrong (Dickinson, et al., 2010; Gardiner, 2012).
The problems arising from the Internet-led explosion of citizen science in the last decade have led to several attempts of answering questions about who and where citizen scientists are, how they behave, and how to improve the quality of their data.
In this article, we study 31 citizen science projects about fauna killed in road collisions, to obtain a first view of where they are based; their average productivity in observations and species; and how data posts change seasonally and as the project ages.
MATERIALS AND METHODS
Our goal was to study the population of citizen science projects in iNaturalist.org, one of the largest citizen science sites in the world. We collected our data in August and November 2017 using the terms roadkill, road-kill and road kill, we found a total of 31 projects. Searching in other languages, with words like atropelamento and atropello, did not produce additional projects. We identified important information from the database such as country, creation date, number of observations, observations per month and per year, number of observers, most common species, observations per person, and species per person.
To prevent false patterns produced by small sample sizes, we only assessed temporal patterns for sites that had been active for at least a year and had at least 50 observations per month. For climatic trends, we excluded sites that mixed data from several climatic patterns. Additionally, for sites with at least 20 observations (N=20) we applied a statistical test to see if projects in which the top five contributors produced a higher proportion of observations (i.e. less participative projects) had less records in total. All the data for this study are freely available for download as Digital Appendix 1.
RESULTS
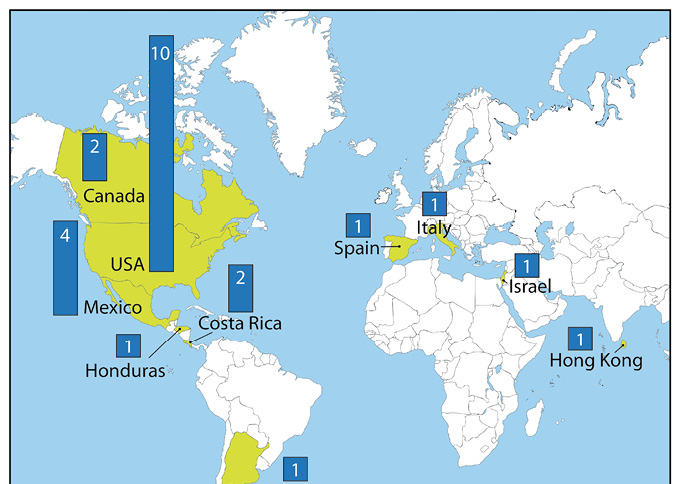
Most citizen science projects are located in the USA, followed by Mexico, Canada and Costa Rica (Digital Appendix 1).
The great majority are in temperate places, while only three are in tropical places (Fig. 1). The seven empty projects (i.e. projects that were started but never added data) are in USA, México and Uruguay.
Average productivity: The mean values per project were: total observations 431,09 (range: 2-953); species 48,32 (1-92); and members 32,35 (1-41). Each person posted a mean of 18,64 observations (range: 1,4-97,4).
Projects can be divided into four types according to the mean number of observations per person. Project Vashon-Maury Roadkill is in a class by itself, with a mean of 97,4 observations per person. A second class, with 20-40 observations per person, has projects from Latin America, Italy and China. The third class, 10-19 observations per person, has projects from Canada, Mexico and Spain. The fourth class, with less than 10 observations per person, corresponds to the rest of projects, from the USA and Israel (Fig. 2).
The mean number of species recorded per person is 3,51 (0,6-12). Excluding the Bobcat and Skunk projects, which are limited to single species, project means range from 0,6 species per person for the temperate site Vashon-Maury, in the USA, to 12 species per person for the tropical DOR Yucatán project in Mexico (Fig. 3).
Curiously, the Vashon-Maury project, which has the highest average of observations per person, has the lowest number of species per person (Digital Appendix 1).
Recruitment of volunteers over time: Recruitment over time had three basic patterns: a rapid increase at the beginning, with lower recruitment as the site got older (Eastern Spotted Skunk and Alava, Spain, projects); a peak near the middle of the projects life (Identificación de Pasos de Fauna Ruta 4, Costa Rica); and no discernible trend over time (the rest of projects; Digital Appendix 2).
Effect of new recruits on observation output: Seven projects increased observations when new members were recruited: Eastern Spotted Skunk (USA), Delta (Italy), Golan (Israel), Mammals of Michigan (USA), Vulture Culture (USA and Canada), Fauna Costa Rica and Roadkill (USA). However, for most projects, records and recruitment had different patterns, indicating that new recruits were not immediately adding new data (Digital Appendix 2).
“Democratization Index”: Projects where top contributors produced a higher proportion of the data had a small tendency to have less data, which may mean that highly productive individuals have a higher impact on small projects (Spearman Rank Correlation, Rs -042; N=20, one tailed p=0.030; two tailed p=0.060; Digital Appendix 2).
Observations versus project lifespan: There were four general trends in observations versus time that the project is operational. The number of monthly observations fell with time in the Vason-Maury project. Three projects had more records in recent times: Delta (Italy), Registros (Mexico) and Fauna (Costa Rica). Fauna Silvestre Atropellada (Costa Rica) and Hong Kong Herpetological (China) were slow the first years but had a large increase in records in their fourth year. An after the first two years, Adventure Scientists Wildlife had a peak in the middle of every year (Digital Appendix 2).
Holidays and seasonality: There were no clear holiday peaks in any of the projects (Digital Appendix 2).
In projects from countries with a tropical pattern of dry and rainy seasons, there were more observations near the end of the dry season (Golan, Fauna Costa Rica, and Identificación de Pasos de Fauna Ruta 4 Costa Rica) and there could be a second peak in the middle of the rainy season (Digital Appendix 2).
There were four general patterns in sites with four seasons: those dominated by a spring peak (Vulture Culture, Adventure Scientists Wildlife, DOR Yucatán, Vashon-Maury and Watch for Wildlife); those dominated by a summer peak (Delta, Italy; Mortalidad Nayarit, Mexico; Registros Mexicanos; and Roadkill, USA); one with a small spring peak followed by a clear autumn peak (Fauna Silvestre Atropellada, Mexico); and one with peaks at the ends of winter, spring and autumn (Alava, Spain) (Digital Appendix 2).
DISCUSSION
This study considers most of the citizen science roadkill projects currently available to the public worldwide, because, with the exception of wildlifecrossing.net, most projects identified by searches in scistarter.com, scientificamerican.com and blog.nature.org are no longer online or available in any way.
Like Cunha et al. (2017), who found that the USA and Europe produced the largest number of formally published citizen science data, we found a western dominance in the number of citizen science projects about our particular subject, roadkills. However, when Cunha et al. (2017) apply the same explanation of resources and culture of private involvement to explain the low numbers for Central America and South America, they are not taking into account that South America has ten times the population of Central America: these two regions should not be expected to have the same output. For this reason, we corrected for population size, and found that proportionally, Mexico, Canada and Costa Rica have a relatively good output. At least in the case of Costa Rica, a tiny Central American country, this result can reflect a combination of widespread access to Internet and high educational level and environmental awareness, an explanation that also applies to Canada and, to a lesser extent, Mexico (Psacharopoulos & Patrinos, 2004).
The geographic location of projects that never entered data shows that this problem can be found in both rich temperate countries and poor tropical countries, and whatever the reason, there is a clear need for more projects in the tropics because they concentrate biodiversity but have less resources to protect it (Reed, Van Vianen, Deakin, Barlow & Sunderland, 2016).
The mean number of 32 volunteers per project that we found matches previous studies, which found that most projects have under 50 people (Aceves-Bueno et al., 2017).
We could not find any studies about the number of observations and species per volunteer or per project, so we cannot compare our results. However, our data are a baseline for future researchers and indicate that, for roadkill citizen science projects, the numbers of observations and species are not large, and this applies to rich and poor countries alike. To increase numbers, projects must invest in dedicated staff that motivate and guide volunteers towards clear goals (Ballard et al., 2017, Newman et al., 2017).
The projects that start with many records, but soon decline, probably reflect the initial enthusiasm that leads many volunteers to sign up for projects but fails when they see the amount of work required (Rotman et al. 2012). The peak near the middle of the project’s life may be the result of a slow but steady growth in the number of people who learn about the project through social networks, because social engagement mechanisms are basic to the success of projects but need time to gain momentum (Price and Dorcas 2011).
The most common finding in our sample, though, is no discernible trend over time, which suggests that administrators fail to achieve a desirable growth for their projects. Successful projects address time consumed by participation, barriers to democratic decision-making and feelings that data will not be used and thus are not worth collecting (Bäckstrand 2003, Sharpe and Conrad 2006; Cunha et al., 2017).
The frequent lack of a clear increase in observations when new members were recruited shows that, as found by previous studies, most volunteers contribute few records and are active for only a few days (Bonney et al., 2009; Eveleigh et al., 2014).
When road traffic increases during holidays, there may be an increase in roadkill mortality (Eloff & Van Niekerk, 2008), but we did not find that increase in the data published by these projects. Maybe, identifying those trends requires a finer look at data (i.e. not only the holiday itself, but a few days before and after the holiday), a better analysis (not all holidays imply more traffic); or maybe the trend simply is not real: for example, Conard & Gipson (2006) did not find higher mortality with traffic increase.
The larger number of observations near the end of the dry season, and in the middle of the rainy season, probably reflects the movement of animals in search of water for drinking (Carvalho & Mira (2011) and for reproduction, a problem that particularly affects amphibians (Arévalo et al, 2017).
For temperate climates, project differences probably depend on the species under study, because higher roadkill counts have been found in spring for armadillos and opossums (Smith-Patten & Patten, 2008); in summer and fall for birds (da Rosa & Bager, 2012); and in fall for a variety of wildlife species in Kansas (Conard & Gipson, 2006). All of these animals have their own natural history and thus differ in when they are more vulnerable to death in roads.
Our conclusions are limited to our population (i.e. citizen science projects about roadkills in iNaturalist.org until the year 2017) and it remains to be seen if other projects have the same overall patterns. Additionally, in some cases, like the number of species reported per volunteer or patterns along the lifespan of projects, there seem to be no previous studies, so we hope this article will inspire others to analyze such topics in other projects.
REFERENCES
Aceves-Bueno, E., Adeleye, A. S., Feraud, M., Huang, Y., Tao, M., Yang, Y., & Anderson, S. E. (2017). The Accuracy of Citizen Science Data: A Quantitative Review. Bulletin of the Ecological Society of America, 98, 278–290. doi:10.1002/bes2.1336
Arévalo, J. E., Honda, W., Arce-Arias, A., & Häger, A. (2017). Spatio-temporal variation of roadkills show mass mortality events for amphibians in a highly trafficked road adjacent to a national park, Costa Rica. Revista de Biología Tropical, 65(4), 1261-1276.
Ballard, H. L., Robinson, L. D., Young, A. N., Pauly, G. B., Higgins, L. M., Johnson, R. F., & Tweddle, J. C. (2017). Contributions to conservation outcomes by natural history museum-led citizen science: examining evidence and next steps. Biological Conservation, 208, 87-97.
Bonney, R., Cooper, C. B., Dickinson, J., Kelling, S., Phillips, T., Rosenberg, K. V., & Shirk, J. (2009). Citizen science: a developing tool for expanding science knowledge and scientific literacy. BioScience, 59(11), 977-984.
Carvalho, F., & Mira, A. (2011). Comparing annual vertebrate road kills over two time periods, 9 years apart: a case study in Mediterranean farmland. European Journal of Wildlife Research, 57(1), 157-174.
Chandler, M., See, L., Copas, K., Bonde, A. M., López, B. C., Danielsen, F., ... & Rosemartin, A. (2017). Contribution of citizen science towards international biodiversity monitoring. Biological Conservation, 213, 280-294.
Conard, J. M., & Gipson, P. S. (2006). Spatial and seasonal variation in wildlife-vehicle collisions. Prairie Naturalist, 38(4), 251.
Cunha, D. G., Marques, J. F., Resende, J. C., Falco, P. B., Souza, C. M., & Loiselle, S. A. (2017). Citizen science participation in research in the environmental sciences: key factors related to projects’ success and longevity. Anais da Academia Brasileira de Ciências, 89(3), 2229-2245.
da Rosa, C. A., & Bager, A. (2012). Seasonality and habitat types affect roadkill of neotropical birds. Journal of Environmental Management, 97, 1-5.Dickinson, J. L., Shirk, J., Bonter, D., Bonney, R., Crain, R. L., Martin, J., ... & Purcell, K. (2012). The current state of citizen science as a tool for ecological research and public engagement. Frontiers in Ecology and the Environment, 10(6), 291-297.
Dickinson, J. L., Zuckerberg, B., & Bonter, D. N. (2010). Citizen science as an ecological research tool: challenges and benefits. Annual review of ecology, evolution, and systematics, 41, 149-172.
Eloff, P., & Van Niekerk, A. (2008). Temporal patterns of animal-related traffic accidents in the Eastern Cape, South Africa. South African Journal of Wildlife Research, 38(2), 153-162.
Eveleigh, A., Jennett, C., Blandford, A., Brohan, P., & Cox, A. L. (2014, April). Designing for dabblers and deterring drop-outs in citizen science. In Proceedings of the 32nd annual ACM conference on Human factors in computing systems (pp. 2985-2994). ACM.
Fleur, N. St. (2017, April 23). Rattled by Trump Policies, Scientists Take to Streets. New York Times, pp. A25.
Gardiner, M. M., Allee, L. L., Brown, P. M., Losey, J. E., Roy, H. E., & Smyth, R. R. (2012). Lessons from lady beetles: accuracy of monitoring data from US and UK citizen-science programs. Frontiers in Ecology and the Environment, 10(9), 471-476.
Gest, H. (2004). The discovery of microorganisms by Robert Hooke and Antoni Van Leeuwenhoek, fellows of the Royal Society. Notes and Records of the Royal Society, 58(2), 187-201.
Gommerman, L., & Monroe, M. C. (2012). Lessons learned from evaluations of citizen science programs. Gainesville, FL: School of Forest Resources and Conservation, Florida Cooperative Extension Service, Institute of Food and Agricultural Sciences, University of Florida.
McKinley, D. C., Miller-Rushing, A. J., Ballard, H. L., Bonney, R., Brown, H., Cook-Patton, S. C., ... & Ryan, S. F. (2017). Citizen science can improve conservation science, natural resource management, and environmental protection. Biological Conservation, 208, 15-28.
Newman, G., Chandler, M., Clyde, M., McGreavy, B., Haklay, M., Ballard, H., ... & Gallo, J. (2017). Leveraging the power of place in citizen science for effective conservation decision making. Biological Conservation, 208, 55-64
Psacharopoulos, G., & Patrinos, H. A. (2004). Returns to investment in education: a further update. Education economics, 12(2), 111-134.
Ratton, P., Secco, H., & Da Rosa, C. A. (2014). Carcass permanency time and its implications to the roadkill data. European journal of wildlife research, 60(3), 543-546.
Reed, J., Van Vianen, J., Deakin, E. L., Barlow, J., & Sunderland, T. (2016). Integrated landscape approaches to managing social and environmental issues in the tropics: learning from the past to guide the future. Global change biology, 22(7), 2540-2554. doi:10.1111/gcb.13284
Rotman, D., Preece, J., Hammock, J., Procita, K., Hansen, D., Parr, C., ... & Jacobs, D. (2012, February). Dynamic changes in motivation in collaborative citizen-science projects. In Proceedings of the ACM 2012 conference on computer supported cooperative work (pp. 217-226). ACM.
Smith-Patten, B. D., & Patten, M. A. (2008). Diversity, seasonality, and context of mammalian roadkills in the southern Great Plains. Environmental Management, 41(6), 844-852.
RESUMEN: Ciencia ciudadana y muerte en carreteras: tendencias a lo largo de la vida de los proyectos y comparación de proyectos tropicales y templados. La recolección de datos científicos por personas sin un título científico es al menos tan antigua como Antonie van Leeuwenhoek, pero ahora gracias a los teléfonos inteligentes involucra a un gran número de voluntarios, lo que lleva a estudios sobre quiénes son los llamados “científicos ciudadanos”, cómo se comportan y cómo mejorar su trabajo. Sin embargo, no hay estudios mundiales sobre proyectos de ciencia ciudadana que informen sobre la fauna muerta en colisiones viales. Aquí analizamos los datos de los 31 proyectos disponibles en septiembre 2017 en iNaturalist.org, uno de los sitios de ciencia ciudadana más grande del mundo. Encontramos que Estados Unidos y Europa dominan en número, pero después de corregir el tamaño de la población, países como Costa Rica y Canadá tienen un número significativo de proyectos, posiblemente gracias al acceso generalizado a Internet y los altos niveles educativos. Los proyectos tuvieron una media de 431 observaciones, 48 especies, y 32 voluntarios que publicaron 19 observaciones cada uno en promedio. La mayoría de los voluntarios contribuyeron con pocos registros y estuvieron activos brevemente. En los trópicos, la mortalidad estacional parece reflejar el movimiento de los animales en busca de agua para beber o reproducirse, mientras que en los sitios templados las diferencias entre proyectos dependen de la especie. Para estudios futuros, recomendamos analizar cómo cambian los voluntarios y los proyectos con el tiempo, un tema que rara vez se ha tenido en cuenta en estudios previos.
Palabras clave: mortalidad en carreteras; ecología de carreteras; comunidad; voluntarios; bases de datos en línea.
Fig. 1. Projects per country around the world.
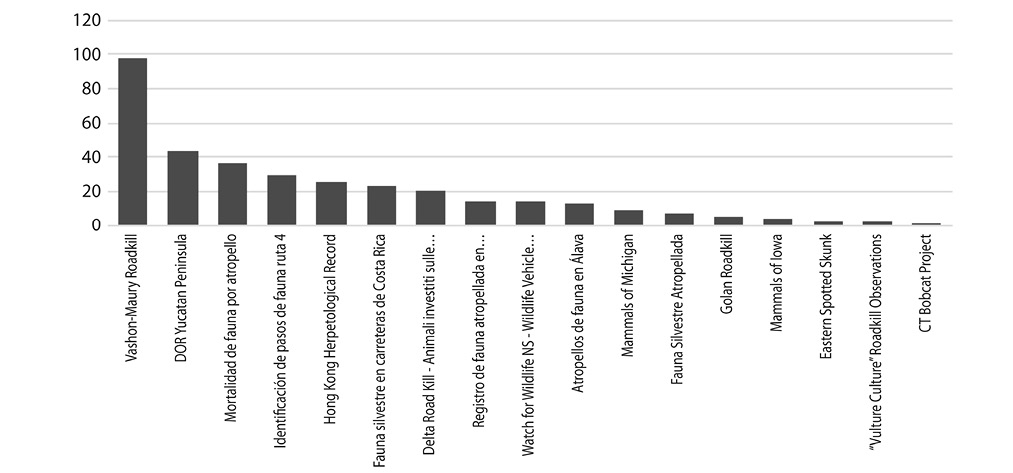
Fig. 2. Observation per person per project.
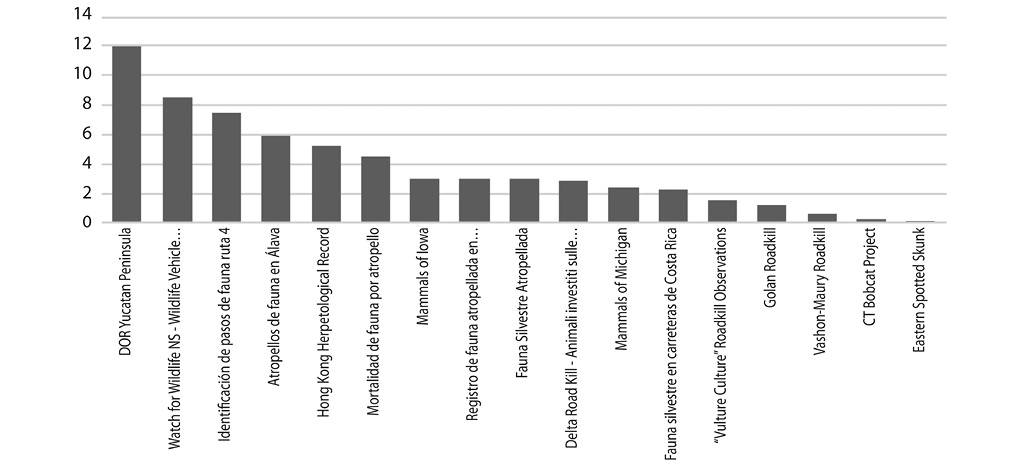
Fig. 3. Species per person per project.
EDITED BY FRANK GONZÁLEZ
See Digital Appendix at: / Ver Apéndice digital en: http://investiga.uned.ac.cr/revistas/index.php/cuadernos