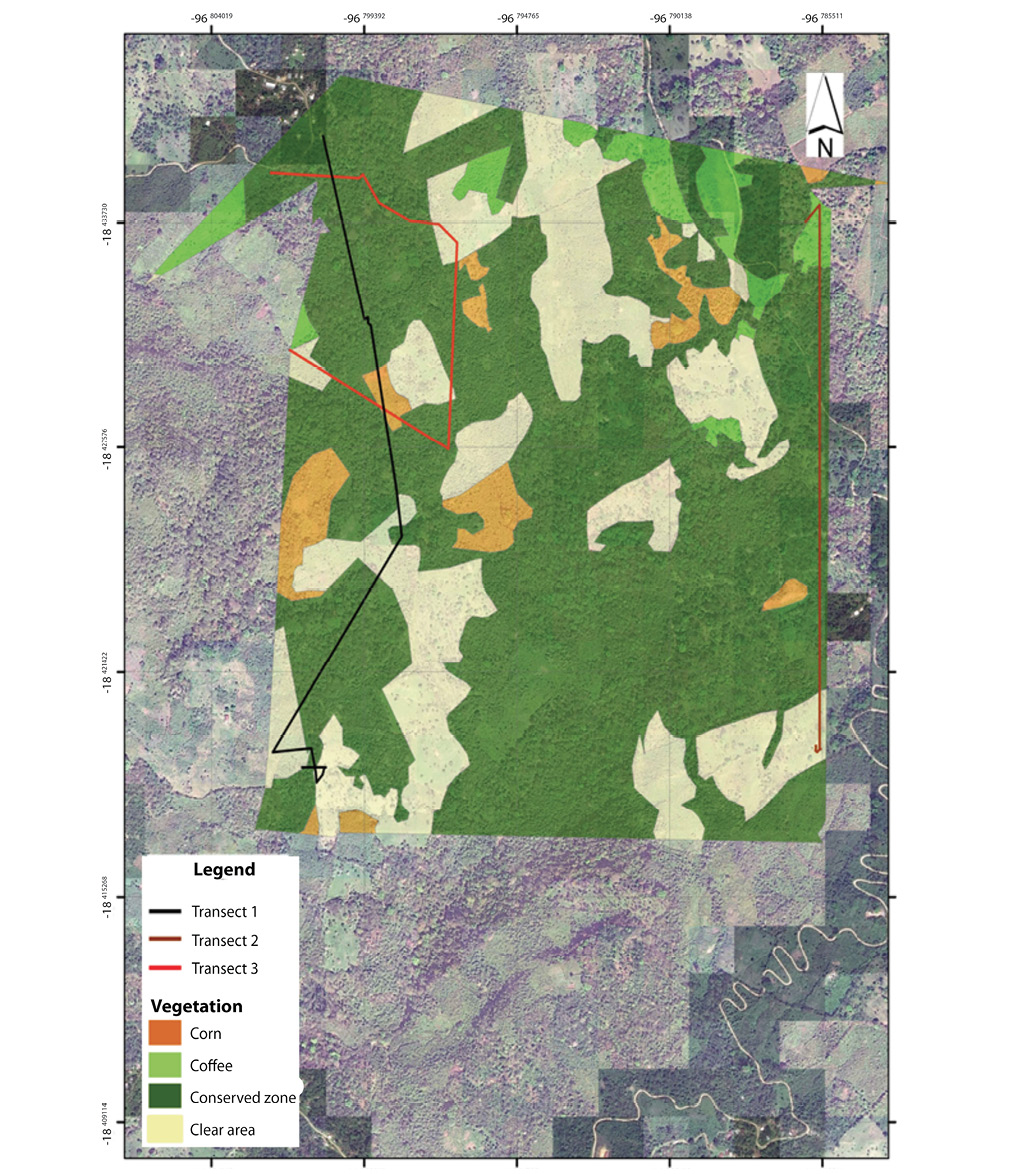
Fig.1. Transects at the study site.
Comparison of three models of population density estimation
for Central American red brocket deer (Mazama temama)
Giovana Lizet Apan-Araujo1, Susana Aurora González2, Arcángel Molina- Martínez1, Daniel Jiménez G.3 &
Oscar Agustín Villarreal E.B4
1. Maestría en Manejo Sostenible de Agroecosistemas, Centro de Agroecología y Ambiente, Instituto de Ciencias, Benemérita Universidad Autónoma de Puebla, edificio VAL 1, Km 1.7 carretera San Baltazar Tetela, C.P. 72960, San Pedro Zacachimalpa, Puebla, México;
iaz_glaa@hotmail.com, armoma8@yahoo.com.mx.
2. Departamento Biodiversidad y Genética IIBCE-MEC, Facultad de Ciencias-U de la R, Uruguay. Avenida Italia 3318 Montevideo 11600. Uruguay; sugonza9@yahoo.com
3. Laboratorio de Biodiversidad, Centro de Agroecología y Ambiente. Centro de Agroecología y Ambiente. Instituto de Ciencias, Benemérita Universidad Autónoma de Puebla, edificio VAL 1, Km 1.7 carretera San Baltazar Tetela, C.P. 72960, San Pedro Zacachimalpa, Puebla, México; daniel.jimenez@correo.buap.mx
4. Facultad de Medicina Veterinaria y Zootecnia, Benemérita Universidad Autónoma de Puebla, Domicilio conocido, El Salado, Tecamachalco, Puebla, México; oscar.villarrealeb@hotmail.com
Received 24-vi-2017 • Corrected 30-viii-2017 • Accepted 18-iX-2017
ABSTRACT: The deer Mazama temama has a wide range in the tropical rain forest of Mexico, but the IUCN classifies it as Data Deficient, and information is urgently need for management and conservation. Here we assess which population density estimation model is more appropriate among those by Tyson (1959), Mandujano and Jones (2005) and Crego and Macri (2009). We compare them with field data from Tepetla (Puebla, Mexico), from 2015 to 2017, with three replicates in the wet season and three in dry season. An ANOVA indicated that the three methods produce equivalent results.
Key words: Mazama, micorregions, endemism, Tepetla, estimation models
In Mexico there are five species of deer, including the Central American red brocket deer (Mazama temama, Kerr, 1792) (Groves & Grubb, 1987; Barbanti, González & Maldonado, 2008). It has a wide range in the tropical rain forest of Mexico, from Tamaulipas, following the slope of the Gulf, to the south and southeast (Pérez-Solano & Mandujano, 2013). The species is not well known and the International Union for the Conservation of Nature (IUCN) classifies this deer as Data Deficient. Information is urgently need for management and conservation.
In the central-eastern region of Mexico (Puebla), there is a tropical rain forest relict in the Sierra Negra with over 27 000 ha fit for the species (INAFED, 2010; Villarreal et al., 2014). The region is home to mostly Nahuatl indigenous communities that have maintained a ritual hunting tradition (Méndez, 2013 & Mateos, 2015). The species was previously reported by Villarreal, Hernández, Franco, García and Utrera (2013) in four municipalities, among them San Sebastián Tlacotepec, in Tepetla. The objective of this work was to determinate what population density estimation model is most useful to estimate the population density of this deer. Scientific knowledge will contribute to design a management plan, conservation alternatives and sustainable uses for its inhabitants.
MATERIALS AND METHODS
Study site: This research was carried out in an area of 382,62ha located in the town of Tepetla, belonging to the municipality of San Sebastián Tlacotepec, Puebla, Mexico (18°26 ‘15.14”N and 96°48’6.19”W), at 320 m.a.s.l (GeoHack, 2015), according to the INEGI (2015) in a hot humid climatic zone, in a relict of high perennial forest among other vegetative types (INAFED, 2010). The municipality is bordered to the North by the state of Veracruz and the municipality of Eloxochitlán, to the South with the state of Oaxaca, to the East with the state of Veracruz and Oaxaca and to the West with the municipalities of Coyomeapan, Eloxochitlán and Zoquitlán. Its orography is rugged characterized by its rapid descent towards the coastal plain of the Golf of México, besides that it belongs to the Sierra Madre Oriental and to the basin of Papaloapan, zone denominated like Sierra Negra with a temperature between 31,3oC and 15,9oC (CONAGUA, 2017).
Methodology: The population density of the Central American red brocket deer was estimated using tree transects every three months between September 2015 and March 2017. The sampling time approximately was between 8 a.m. at 2 p.m., in that hours because of three causes mainly, one because thanks of the knowledge of the people about the deer, we knew this species has night habits, for this reason it was more easy found the footprints in early hours of the day, two because the shooters practice after the lunch and in the night in find of felines, three because in wet season the climatic conditions are very changing and the geographic area of the study is very abrupt and it could be a security risk for us and the guides.
The three transects were located in the sidewalks in common use, the transect one had 1,91Km, the two with 1,77Km and the three with 2,4 km, for the estimation was used the indirect method of count of tracks, which has been applied by Villarreal et al. (2005 and 2013). The tracks counting is a methodology that has been successfully validated in the Northeastern Sierra de Puebla with Veracruz white-tailed deer (Odocoileus virginianus veraecrucis) (Villarreal et al., 2005) and Central American red brocket deer (Villarreal et al., 2013).
The data obtained were analyzed for wet season and dry season by three models. The first one proposed by Tyson (1959), the assumptions of the model are: a) The range of activity of an individual is within a square mile diameter (1,6Km2) and b) The deer stays in that place during consecutive days. The formula used is D=H/L, where: D= the population density of deer per square mile, H= the total number of traces and L= the total number of miles traveled. The second model was suggested by Crego and Macri (2009), for fixed-width transects, the formula to obtain density according to this model is: D=n/wL, where D= a population density within the transect, n= The number of detections, w= the width of the transect and L= the distance of the transect traveled. The third model is suggested by the Secretaría de Medio Ambiente, Recursos Naturales y Pesca (SEMARNAT, 2007), according to the formula proposed by Mandujano and Jones (2005), D=(IT)/(L*2*W/L *L), Where D= a population density, IT= number of crosses of groups of traces between the number of transects, w= estimated average width in the transects of the study site in meters and L= the length of the transect in meters.
Statistical analysis: In order to know if there are differences between the population estimates of each model in wet and dry season, we conducted a “t” student test. Additionnally, we performed comparisons of the three models data using a unifactorial ANOVA test, to know if there is any difference between the results of the models per season. The t-tests and unifactorial ANOVA were performed with the IBM SPSS® version 21 statistical package.
RESULTS
The sampling effort for the three transects was 152 km linear (Fig. 1). It is observed that in the annual results of each model the Tyson yields a higher density than the other two (Table 1). The PD estimated under the Tyson model was higher for the dry and wet seasons than the other two models. In the dry season, it is observed that the result between the Crego and Macri model and the Mandujano model yielded the same result, the average of the three models differs in rainy season. When analyzing the data, it was observed that no model showed a significant seasonal difference (Table 2). Analysis of the ANOVA indicated that there was no significant difference between the PD estimation models since a P = 0,642 was obtained for the dry season and a P = 0,367 for wet.
DISCUSSION
There are few studies about Central American red brocket deer (Mazama temama), some of them describe his location, feeding or is mentioned in researches of others species. We detected that fragmentation and poaching are the main reasons of population’s decreases. Some local and indigenous communities in Mexico are close to this species because they have a cultural, religious, historical and alimentary linkage.
The population density, PD, in the study site estimated under three models, is below that reported by González, Gallina, Mandujano and Weber (2008) for the Eden reserve, Quintana Roo (1,7 deer/Km2) with the Mandujano and Jones model, but not for what was found in Calakmul, Campeche (0,09 deer/Km2) and 0,31 deer/Km2 and 0,32 deer/Km2 for Chiapas (Naranjo & Bolaño, 2003 and Lira-Torres & Naranjo-Piñera, 2003, respectively) in the two cases the investigators use the Buckland model. In the case of Calakmul, it may be due to interspecific competition for natural resources, since the tropical rain forest present in this area has a great biodiversity (Neyra & Durand, 2008). In the case of the state of Puebla, Villarreal et al. (2013) used the Mandujano and Jones model and report for the Northeastern Range between 8,3deer/km2 and 3,7deer/Km2, however for the same municipality the results are of 4,2 deer/Km2, observing a high PD, this difference could be due to the fact that in the work described was scarce and during a single time of the year. The low PD found in this study may be due to the competition with cattles in extensive exploitation, besides this site has a fragmented habitat because of the introduction of robusta coffee (Coffea canephora). Moreover Villarreal et al. (2013) comment is not reached the Population Size Minimum Viable (PSMV) of 500 deers suggested by Mandujano (2011) because the land where the Central American red brocket deer lives is very small for an adequate management to increase its PSMV. In addition with all of this the Central American red brocket deer it is subject to poaching not only in Tepetla but throughout its regional distribution.
There are no significant differences between models to estimate the density of Central American red brocket deer, because of this reason it can be applied any of the models used in this study to evaluate the PD of this species, although the most used model to estimate the PD in deers is that of Mandujano and Jones (2005), since the one suggested by Crego and Macri (2009) is used interchangeably in several species, and the Tyson (1959) model is used to mammals without distinction. We recommend future study to establish a distribution of the regional density of this species and an adequate management plan for this deer.
Finally, we urged multidisciplinary research to suggest sustainable alternatives of production, such as the creation of a Management Unit for Wildlife Conservation (UMA), by non-extractive sustainable use in response to the low PD. If the unsustainable hunting and farming practices persist, the Central American red brocket deer will remain in a state of vulnerability, not only in Puebla but throughout its range.
REFERENCES
Aranda, S. J. M. (2015). CONABIO (Comisión Nacional para el Conocimiento y Uso de la Biodiversidad). Manual para el rastreo de mamiferos silvestres de México. México.
Barbanti, D. J. M.; González, S. & Maldonado, J. E. (2008). The surprising evolutionary history of South American deer. Molecular Phylogenetics Evolution, 49 (1), 17-22.
CONAGUA (Comisión Nacional del Agua) (2017). Climatological information. Retrieved from http://smn.cna.gob.mx/es/informacion-climatologica-ver-estado?estado=pue
Crego, R. D., & Macri, I. N. (2009). Una técnica para la estimación de la densidad y el monitoreo de poblaciones de Inambú Común (Nothura maculosa) en ambientes de pastizal. El hornero, 24(1), 31-35.
GeoHack - Tepetla, San Sebastián Tlacotepec. (s/f). Retrieved from https://tools.wmflabs.org/geohack/geohack.php?language=es¶ms=18.43754_N_6.80172_E_type:city&pagename=Tepetla,_San_Sebasti%C3%A1n_Tlacotepec
González, R.; Gallina, S.; Mandujano, S., & Weber, M. (2008). Densidad y distribución de ungulados silvestres en la reserva biológica El Edén, Quintana Roo, México. Acta Zoológica Mexicana 24 (1), 73-93. Retrieved from http://www.scielo.org.mx/scielo.php?script=sci_arttext&pid=S0065-17372008000100004&lng=es&tlng=es.
Groves, C. P., & Grubb, P. (1987). Relationships of living deer. In: Wemmer, C. M. (ed.), Biology and Management of the Cervidae. Washington, USA: Smithsonian Institution.
IBM. (2012). SPSS, Statistical Package for the Social Sciences. Chicago, USA: SPSS Inc.
INAFED (Instituto para el Federalismo y el Desarrollo Municipal). (2010). Secretaría de Gobernación. México. Retrieved from http://www.inafed.gob.mx/work/enciclopedia/EMM21puebla/.
INEGI (Instituto Nacional de Estadística y Geografía). México. (2015). Retrieved from http://www.cuentame.inegi.org.mx/monografias/informacion/pue/territorio/clima.aspx?tema=me&e=21.
Lira-Torres, I., & Naranjo-Piñera, E. J. (2003). Abundancia, preferencia de habitat e impacto del ecoturismo sobre el puma y dos de sus presas en la reserva de la biosfera El Triunfo, Chiapas, México. Revista Mexicana de Mastozoología, 7(1), 21-40.
Mandujano, S., & Jones, C. A. (2005). Track count calibration to estimate density of white-tailed deer (Odocoileus virginianus) in mexican dry tropical forest. The Southwestern Naturalist, 50(2), 223–229. doi:10.1894/0038-4909(2005)050[0223:TCCTED]2.0.CO;2
Mandujano, S. (2011). Consideraciones para el manejo el manejo del venado cola blanca en UMA extensivas en bosques tropicales(Pp. 249-275. In Sánchez, O.; Zamorano, P.; Peters, E.; Moya, H. (eds.), Temas sobre Conservación de Vertebrados Silvestres en México) SEMARNAT, México, D.F.
Mateos, E. S. (2015). Venado-serpiente y monte. Fundación Dialnet. Artes de México. Número 117. Dedicado a: La búsqueda del venado.. México.
Méndez S. J. (2013). Cacería y ritual: el caso de los nahuas de San Martín Mazateopan, Puebla. Benemérita Universidad Autónoma de Puebla. Facultad de Filosofía y Letras. Colegio de Antropología Social. México.
Naranjo, E., & Bolaño, J. (2003). Correlación de índices de abundancia y densidades poblacionales de mamíferos en la selva Lacandona, México (Pp. 181-184). Polanco, R. (ed.), Selección de trabajos V congreso internacional de fauna silvestre en Amazonia y Latinoamérica. Bogotá, Colombia.
Neyra, L. G., & Durand, L. S. (2008). Parte II. Recursos naturales. Capítulo 3. In: CONABIO (ed.), La diversidad biológica de México: Estudio de País 1998. Págs. ٦١-١٠٣. México.
Pérez-Solano, L. A., & Mandujano, S. (2013). Distribution and loss of potential habitat of the Central American red brocket deer (Mazama temama) in the Sierra Madre Oriental, Mexico. Deer Specialist Group, News, 25(1), 11-17.
SEMARNAT (Secretaría de Medio Ambiente, Recursos Naturales y Pesca). (2008). Plan de Manejo Tipo de Venado Temazate. Retrieved from https://issuu.com/mauriciomaldonado7/docs/pmt_temazate_actualizado
Tyson, E. L. (1959). A deer drive vs. track census. Transnational North America Wildlife Conference, 24, 457-464
Villarreal, O.; Guevara-Viera, R.; Reséndiz-Martínez, R.; Hernández-Zepeda, J. S.; Castillo-Correo, J. C., & Tomé- Torres, F. J. (2005). Diversificación productiva en el campo experimental las Margaritas, Puebla, México. Archivos de Zootecnia, 54 (206-207), 197 – 203. Retrieved from http://www.redalyc.org/articulo.oa?id=49520713
Villarreal, O.; Hernández J.; Franco, F.; García, F. & Utrera, F. (2013). Densidad poblacional del venado temazate rojo (Mazama temama) en dos sierras del estado de Puebla, México. Rev. Colombiana Cienc. Anim., 5(1), 24-35.
Villarreal, E. B. O. A.; Mendoza-Martínez, G. D.; Guevara-Viera, R.; Hernández-Hernández, J. E.; Franco-Guerra, F. J.; Camacho-Ronquillo, J. C. y J. L. Arcos-García. (2014). Distribución regional del venado temazate rojo (Mazama temama) en el estado de Puebla, México. México. Revista Chapingo Serie Ciencias Forestales y del Ambiente, 250-260.
RESUMEN: Comparación de tres modelos de estimación de la densidad poblacional de venados temazate rojo de América Central (Mazama temama). El venado temazate rojo Mazama temama tiene un amplio ámbito en la selva tropical de México, pero la UICN lo clasifica como “Especie sin datos suficientes”, por lo que urge información para su administración y conservación. Aquí evaluamos qué modelo de estimación de densidad de población es más apropiado entre los de Tyson (1959), Mandujano y Jones (2005) y Crego y Macri (2009). Los comparamos con datos de campo de Tepetla (Puebla, México), de 2015 a 2017, con tres repeticiones en la estación húmeda y tres en la estación seca. Un análisis de varianza indicó que los tres métodos producen resultados equivalentes.
Palabras clave: Mazama, microrregiones, endemismo, Tepetla, modelo de estimación
TABLE 1
Average of annual density of Central American red brocket deer in Tepetla, Puebla, Mexico
|
Estimation model |
deer/Km2 |
Ha/deer |
|
Tyson (1959) |
1,035 |
96,62 |
|
Crego & Macri (2009) |
0,65 |
153,85 |
|
Mandujano & Jones (2005) |
0,49 |
204,1 |
deer/Km2 = deers in a square kilometer; Ha/deer = hectares per deer.
Fig.1. Transects at the study site.
TABLE 2
Population density of Central American red brocket deer in dry and wet in Tepetla, Puebla, Mexico
|
Dry |
Wet |
t |
p |
|||
|
Modelo de estimación |
deer/Km2 |
Ha/deer |
deer/Km2 |
Ha/deer |
||
|
Tyson (1959) |
0,62 |
161,29 |
1,45 |
68,96 |
-1,38 |
0,237 |
|
Crego & Macri (2009) |
0,39 |
256,41 |
0,90 |
111,11 |
-1,374 |
0,241 |
|
Mandujano & Jones (2005) |
0,39 |
256,41 |
0,61 |
163,93 |
-0,830 |
0,452 |
deer/km2 = deers in a square kilometer; Ha/deer = hectares per deer; t= result of “t” for two samples; p= significance.